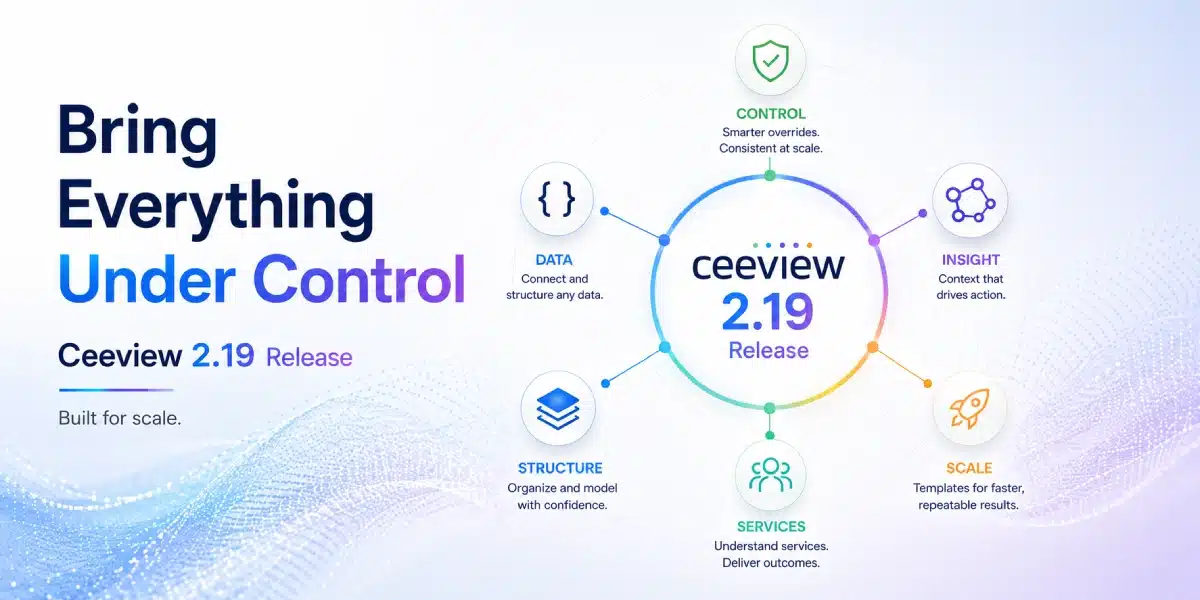
Modern environments create complexity faster than they create control. Ceeview 2.19 introduces a more structured approach—from adaptive monitoring to seamless external data integration—helping teams reduce complexity and turn data into actionable insight. Discover how this release brings greater control, visibility, and speed across every environment.
When we introduced Ceeview 2.18, we shared a glimpse of what was coming next—early signals of a release focused on flexibility, usability, and faster time-to-value.
With Ceeview 2.19, those ideas take a meaningful step forward—introducing a more structured and scalable approach to how monitoring is defined, delivered, and applied across modern environments.
Shaped by real-world needs and close collaboration with both MSP partners operating at scale and enterprise organizations managing complex environments, this release brings together a set of capabilities that make Ceeview easier to deploy, easier to manage, and more adaptable to the way modern environments actually operate.
At the same time, it expands how external data is brought into the platform—making integration more accessible, more structured, and more directly aligned with how operational insight is created.
One Monitor, Many Realities: A Smarter Approach to Configuration
As environments scale, the challenge isn’t collecting more data—it’s managing how that data is monitored.
At the core of Ceeview 2.19 is a fundamental rethink of how monitoring should work in modern environments.
Introducing Asset Overrides
In most monitoring platforms, variation creates complexity.
As environments grow, teams are forced to:
- Split assets into rigid groups
- Duplicate monitors for minor differences
- Manage an expanding web of policies and exceptions
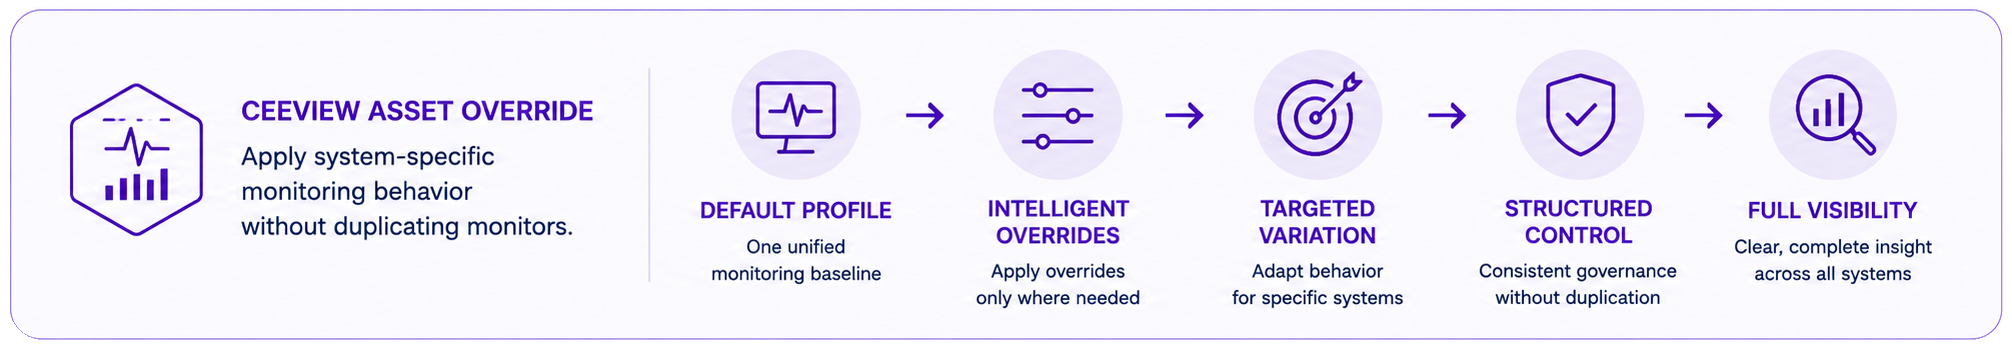
Ceeview 2.19 takes a different approach.
A single monitor can now adapt intelligently across all assets it governs.
- Define a default monitoring profile once
- Apply precise overrides where needed
- Adjust thresholds, metrics, or behavior—without duplicating configuration
This creates a structured model where:
- Most systems follow a consistent baseline
- Exceptions are handled cleanly and explicitly
- Everything remains visible within a single, unified monitor
Built for Real-World Environments
No two environments are perfectly uniform—and they shouldn’t have to be.
With asset overrides, Ceeview allows monitoring to reflect reality:
- High-load systems can tolerate different thresholds
- Specialized servers can follow unique rules
- Non-critical assets can be excluded entirely
All without fragmenting configuration.
Consistency Where You Want It. Control Where You Need It.
Overrides are not just static exceptions—they are part of a dynamic model:
- Inherit from the default to maintain consistency at scale
- Override selectively to address specific needs
- Detach when necessary to lock in custom behavior
This balance is what makes the capability powerful.
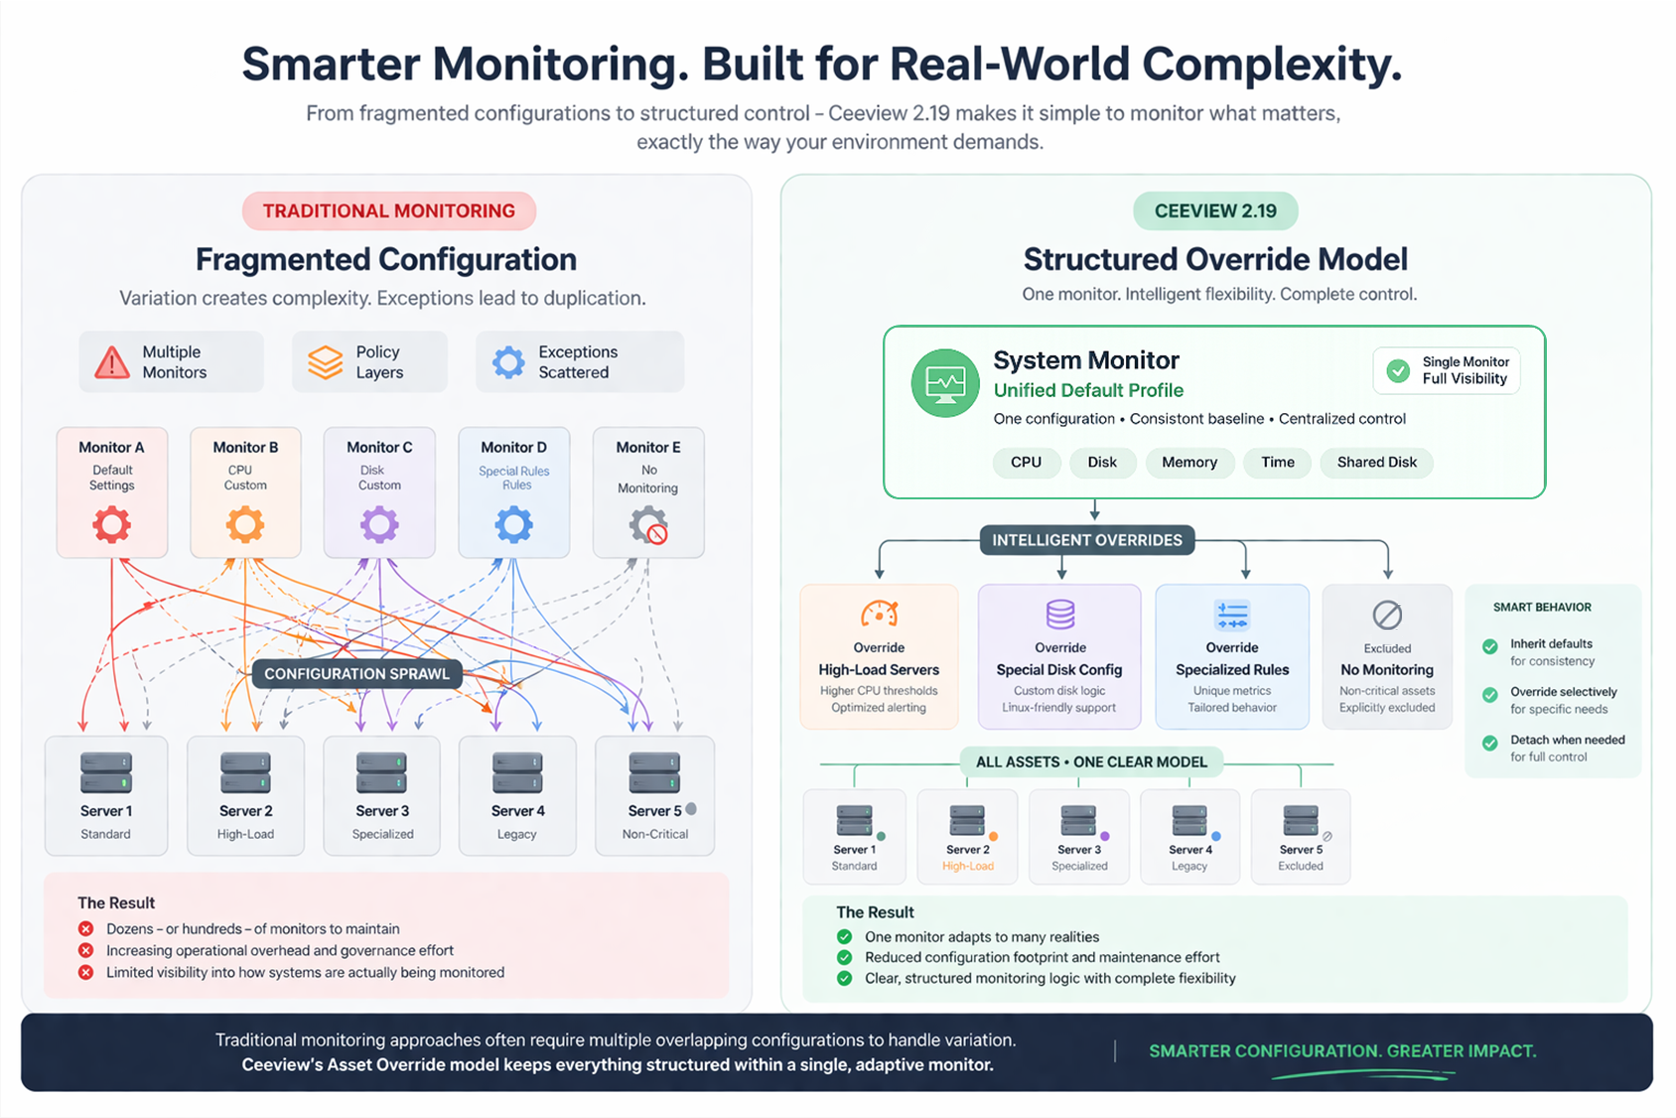
From Configuration Sprawl to Controlled Simplicity
Where traditional approaches lead to:
- Dozens—or hundreds—of monitors
- Increasing maintenance overhead
- Reduced visibility into how systems are actually monitored
Ceeview 2.19 delivers:
- Centralized control
- Reduced configuration footprint
- Clear, structured monitoring logic
Where This Comes to Life: The New System Monitor
The Asset Override model is not just conceptual—it is fully realized in Ceeview 2.19 through the newly redesigned System Monitor.
Designed to manage the most critical aspects of infrastructure monitoring—CPU, memory, disk, time, and shared disk—the System Monitor provides the ideal foundation for applying structured overrides across real-world environments.
With this new implementation, teams can:
- Apply a consistent monitoring baseline across all systems
- Introduce targeted overrides across multiple dimensions of monitoring
- Manage variation without fragmenting configuration
Because the System Monitor spans multiple layers of system behavior, it showcases the full power of the override model—allowing different systems to be monitored differently across CPU, memory, disk, and more, all within a single, unified configuration.
This capability also extends to other core monitors in Ceeview 2.19, including Process and Performance monitors.
The figure below shows the difference: from configuration sprawl to structured control.
Accelerating Solution Readiness with Smarter UI Development
Faster Access to New Capabilities
A key advancement in 2.19 is how Ceeview delivers new functionality to users.
Historically, advanced monitoring capabilities could exist within the platform but required custom UI development before they were fully accessible. In 2.19, a new approach enables backend developers to define user interface behavior as part of the solution itself. This is powered by an internal annotation framework, allowing user interfaces to be generated directly from backend definitions.

User interfaces are generated directly from backend definitions—reducing development effort and accelerating feature availability.
The result:
- Faster availability of new monitoring capabilities
- Reduced dependency on specialized UI development cycles
- More rapid transition from feature creation to customer use
This means capabilities that were previously available only through scripting or internal configuration can now be delivered with a fully usable interface—much sooner.
For customers, this translates directly to:
Quicker access to powerful features and faster time-to-value
A Clear Example: Windows Performance Monitor
One of the first capabilities to benefit from this approach is the Windows Performance Monitor.
Previously available only through scripting, it is now fully accessible through an intuitive interface—built using the same annotation-driven UI framework.
Teams can now:
- Select performance counters visually
- Build reusable monitoring profiles
- Apply overrides without writing scripts
This reflects a broader direction in Ceeview:
Making advanced capabilities easier to adopt and use
Expanding Visibility Through External Data
REST Monitor
Ceeview 2.19 introduces a powerful new way to bring external data into the platform—through the REST Monitor.
But this is more than API connectivity.
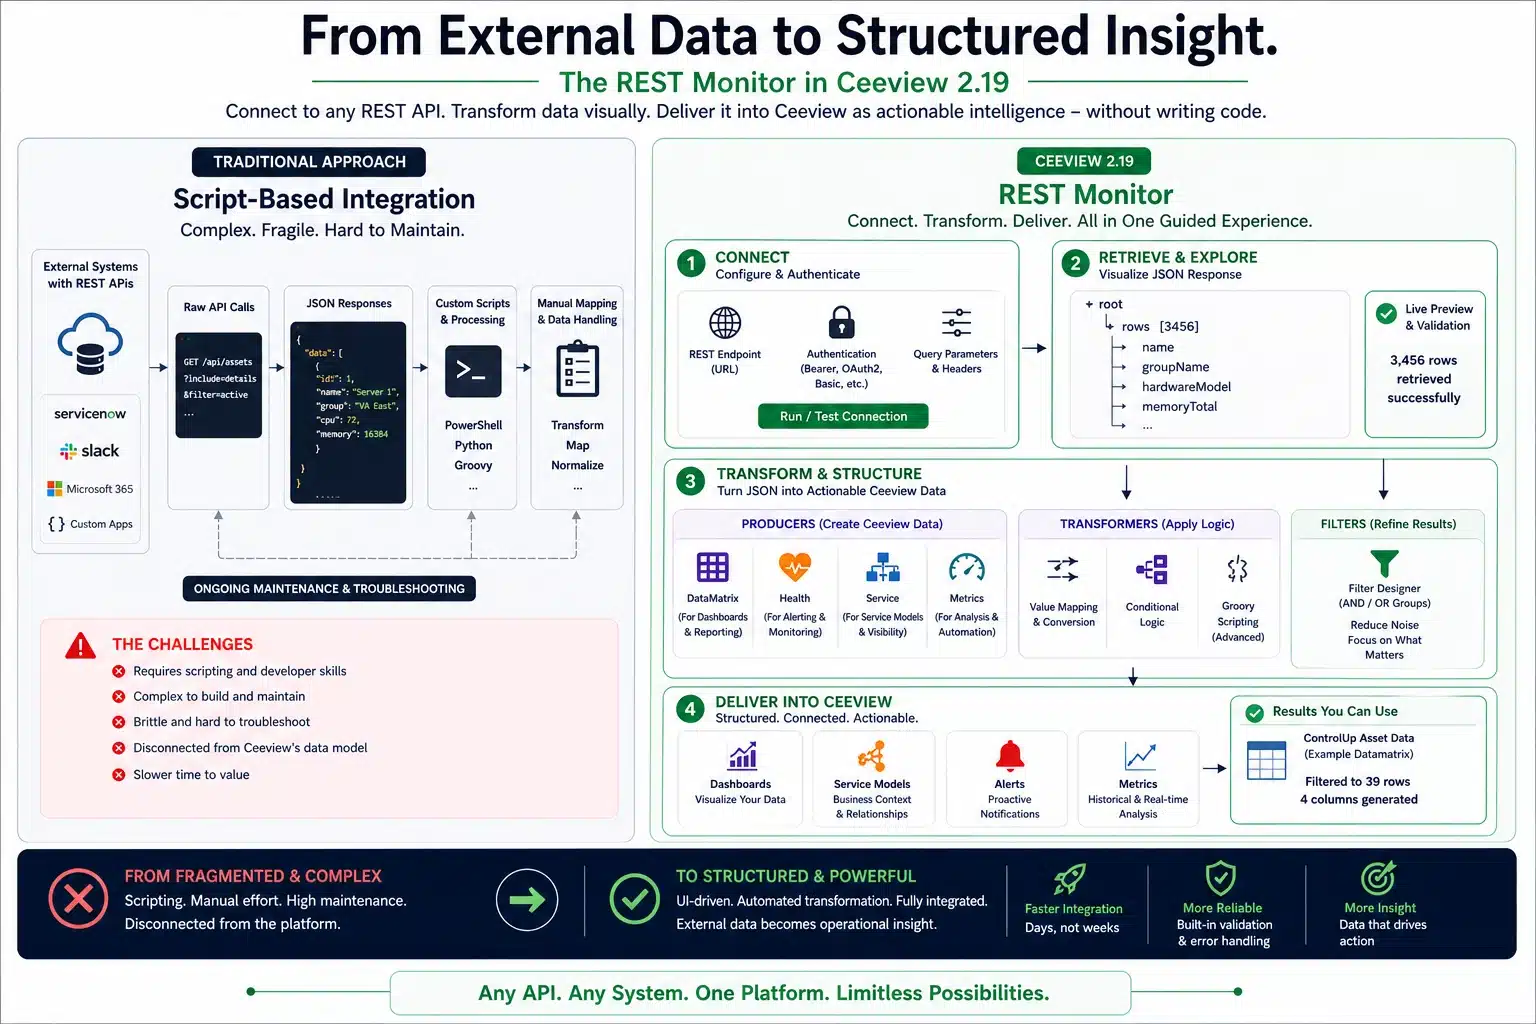
It’s a structured, UI-driven approach to transforming external data into actionable operational insight.
Traditionally, integrating REST APIs has required scripting, manual transformation, and ongoing maintenance.
The REST Monitor replaces that complexity with a guided experience—allowing teams to connect to virtually any REST-enabled system without writing code.
Once connected, users are guided through a complete data workflow:
- Connect to external REST endpoints
- Retrieve structured JSON data
- Visually explore and select relevant elements
- Transform and structure data using built-in logic
- Deliver outputs directly into Ceeview’s data model
From this single workflow, teams can produce multiple types of operational intelligence:
- Data matrices for dashboards and reporting
- Health signals for monitoring and alerting
- Service model data for business visibility
- Metrics for analysis, trending, and automation
This is where the REST Monitor fundamentally changes the model.
Instead of treating external data as something separate—requiring custom pipelines and tooling—it becomes native to Ceeview, shaped and delivered through a consistent, reusable framework.
All of this is delivered through a guided interface that combines visual configuration with powerful transformation capabilities.
The result:
External data is no longer just integrated—it becomes structured, contextual, and immediately actionable.
From Manual Setup to Scalable Deployment
Template-Based Monitor Distribution
As monitoring becomes more structured and accessible, the next step is deploying it consistently at scale.
Ceeview 2.19 introduces a major efficiency gain for multi-environment operations:
- Create a template monitor once
- Distribute it across multiple environments or accounts
- Automatically deploy:
- Monitor configuration
- Asset groups
- Dynamic discovery rules
Monitoring begins automatically as new assets appear—no additional setup required.
This significantly reduces onboarding effort and ensures consistency, supporting a more scalable and repeatable approach to monitoring.
Cleaner Organization, Faster Access
Dashboard Folder Structure
As monitoring expands across environments, organization becomes critical.
Ceeview 2.19 introduces folder-based dashboard grouping—making it easier to:
- Navigate large dashboard collections
- Structure views by customer, service, or function
Modernized Cost Dashboards
Cost dashboards have been refreshed with:
- Improved design
- Template-based deployment
- DataSource-driven architecture
This makes them easier to deploy, maintain, and scale across environments.
Beyond the Headline Features
Ceeview 2.19 also includes a range of enhancements that improve usability, visibility, and day-to-day operations across the platform.
Some notable updates include:
- Dashboard usability and functionality improvements, including global time controls, versioning and read-only options, improved chart behavior, and clearer navigation actions
- Improved account navigation, with full account tree visibility when drilling down—making it easier to work across complex environments
- Stronger audit and configuration visibility, including improved logging for monitor and asset group updates, along with clearer safeguards for key actions
- Expanded time-range support for data analysis, including dynamic metric intervals and extended event visibility beyond default limits
- Security improvements for integrations, including enhanced encryption for persisted API keys in ConnectWise gateway configurations
Together, these updates reflect a continued focus on refining the platform—not just introducing new capabilities, but improving how teams interact with and manage Ceeview in real-world environments.w
Built with Customers. Designed for What’s Next.
Ceeview continues to evolve through close collaboration with its users.
- MSP-driven requirements are shaping scalable, repeatable service models
- Enterprise use cases are expanding visibility across increasingly complex environments
This ensures that each release is grounded in practical needs—delivering capabilities that drive measurable value.
Looking Ahead
Ceeview 2.19 is a focused release—but an important one.
It introduces a more scalable and structured approach to monitoring—where complexity is managed through design, not additional configuration.
From the Asset Override model to expanded visibility through external data, this release reflects a clear direction:
- More precise control over how systems are monitored
- Broader visibility into the data that matters
- Faster delivery of capabilities into the hands of users
Together, these advancements reduce operational friction while enabling teams to move faster with greater clarity and confidence.
And they set the stage for continued innovation across the platform.
Explore What You Can Build with Ceeview
Whether you’re delivering services at scale or driving performance within your organization, Ceeview 2.19 enables a more structured, flexible approach to monitoring—where complexity is managed through design, and visibility extends to the data that matters most.
With greater control over how systems are monitored, broader access to meaningful data, and faster access to new capabilities, teams can move forward with greater clarity and confidence.
About the Author: